

The U.S. stock market retreated in the 3rd quarter as expectations shifted to interest rates remaining higher for longer. The case for “higher for longer” is to continue to drive inflation lower amid a resilient economy. While inflation has been falling, the U.S. employment picture is still strong. In the short-term, markets respond to either missing or beating expectations in relation to economic data that is reported. Good economic news can sometimes have a negative impact on the market because in our current scenario it could mean interest rates need to stay higher for longer. The U.S. Federal Reserve is continuing to try to balance taming inflation and slowing the economy without inducing a recession.
For the 3rd quarter (July – September), the U.S. stock market pulled back (S&P 500) -3.3%, U.S. small companies (Russell 2000) -5.1%, International Developed (MSCI EAFE) -4.1%, Emerging Markets (MSCI Emerging Markets) -2.9%. Bonds prices fell as well for the quarter -3.2% (Barclays US Aggregate) as interest rates climbed higher.
Inflation
Inflation continues to move downward over time. The headline consumer price index (CPI) peaked at 9.1% year-over-year in June 2022. In August, that same measure is down to 3.7%. There have been some hot spots recently such as energy prices rising over the summer but expectations are that this should cool off as we get away from summer travel season and approach lower temperatures. Shelter or housing inflation is still the largest factor in the overall CPI and is starting to slow down. While trends change each month, the big picture is that inflation is falling over time towards the 2% Federal Reserve target which is positive.


Interest Rates
To combat inflation, the U.S. Federal Reserve has raised interest rates over 5% in the last 18 months. The swift pace at which this was done is unprecedented and led to a downturn in the stock and bond markets last year. The average interest rate on a 30-year mortgage has risen close to 8%. This is the highest it has been since September 2000 and a massive increase from 2.6% in December 2020. The burning question today is how much farther does the Fed have to go with raising interest rates. Many believe we are at the end or close to the end. Over the last several months stronger economic data has changed expectations that higher rates will be the norm for longer. But, as we have seen in the past, economic data and expectations can change quickly. I believe the longer we go with higher interest rates the more effect it is going to have on slowing the economy which gets us closer to interest rate pauses and eventually cuts. The U.S. Treasury Secretary Janet Yellen was quoted recently saying “higher for longer rates is by no means a given.” On the positive side, higher interest rates have been stimulative for those with cash in the bank as many money market funds are now paying 5% interest.
As we move into the 4th quarter and get more economic data, it is very possible expectations could change again. If economic data comes in softer than expected, we could be at or close to the end of interest rate hikes. Since 1954, once the Fed is done raising interest rates, the average forward 12-month return in the U.S. stock market (S&P 500) has been +14%. The chart below shows six Fed pause instances since 1983 and the subsequent positive investment returns and lower federal funds rate.

Seasonality
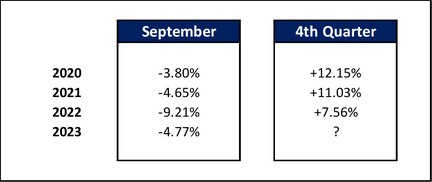
Over history, September is by far the worst month of the year for stock market returns. There has been some speculation that this relates to liquidating securities to pay for summer vacations but no one knows the cause. The last four years have followed this trend for the U.S. market (S&P 500) with a subsequent advance in the 4th quarter.
In addition, the 3rd quarter in a pre-presidential election year going back to 1983 has seen a market decline after an advance in the first part of the year only to resume the advance in the 4th quarter as we approach the holiday season.

While there is no guarantee that historical seasonality will play out every time, it is interesting nonetheless.
Over the last three months, it is clear that expectations shifted to higher interest rates for longer and resulted in a pull back in the stock and bond markets. Look for those expectations to change again in the 4th quarter as we see more of the effect of higher interest rates over time on individuals and businesses. This short-term noise is worth discussing, but long-term trends and expectations remain the most important for successful diversified investing. Stay the course!
If you would like to discuss or learn more, schedule a call or meeting with me using the link below:

Tripp Yates, CPA/PFS, CFP®
901.413.8659 [email protected]
Tripp’s passion for financial planning is evident to each and every client he meets with. His desire is to help his clients organize their finances, reduce taxes, and invest wisely. As a fee-only fiduciary advisor, Tripp strives to work in a humble and transparent way.
With extensive experience in financial planning and investment management, Tripp diligently uses his credentials of CPA and CFP® to benefit his clients. Over the last ten years, he has managed over $100 million in assets for individuals and families. In 2017, he founded Eaglestrong Financial, specializing in helping dentists and business owners. Outside of work, Tripp enjoys running, spending time with his family, and cheering on his favorite sports teams. He is an active member of Harvest Church.
References
Investment returns obtained from Kwanti Portfolio Analytics. 7/1/2023 to 9/30/2023. S&P 500 TR = -3.27%. Russell 2000 Index TR = - 5.13%. MSCI EAFE Index TR = -4.11%. MSCI Emerging Markets Index TR = -2.93%. Barclays US Aggregate Bond Index = -3.23%. 9/1/2023 to 9/30/2023 S&P 500 TR = - 4.77%. S&P 500 TR 10/1/2020 – 12/31/2020 = 12.15%, 10/1/2021 – 12/31/2021 = 11.03%, 10/1/2022 – 12/31/2022 = 7.56%.
J.P. Morgan Guide to the Markets U.S. 4Q 2023 as of September 30, 2023
https://twitter.com/KobeissiLetter/status/1709543815747412126
https://twitter.com/financialjuice/status/1709291656673976519
https://twitter.com/SethCL/status/1705582390490419588
Stocks for the Long Run. Jeremy J. Siegel with Jeremy Schwartz. Sixth Edition.
https://twitter.com/bespokeinvest/status/1706765271938085170
https://twitter.com/SethCL/status/1708224084645965825
Disclaimer: Eaglestrong Financial, LLC is a Registered Investment Advisor offering advisory services in the states of TN and MS and in other jurisdictions where exempted. The information contained herein is not intended to be used as a guide to investing or tax advice. This material presented is provided for educational purposes only and should not be construed as investment advice or an offer or solicitation to buy or sell securities. Past performance is no guarantee of future results.
Disclaimer
Eaglestrong Financial, LLC is a Registered Investment Advisor offering advisory services in the states of TN and MS and in other jurisdictions where exempted. The information contained herein is not intended to be used as a guide to investing or tax advice. This material presented is provided for educational purposes only and should not be construed as investment advice or an offer or solicitation to buy or sell securities. Past performance is no guarantee of future results.
#eaglestrong #eaglestrongfinancial
Share with others: